SRUJAN YAMALI

← BACK TO HOME

Finding recombination in bacterial genomes

Bacteria do not only inherit their genomes down the family tree. They also take DNA from each other, and a block that arrived that way carries the history of wherever it came from rather than the history of the chromosome it now sits in. Working out which stretches arrived that way is how you tell whether a resistance gene spread by descent or by transfer.

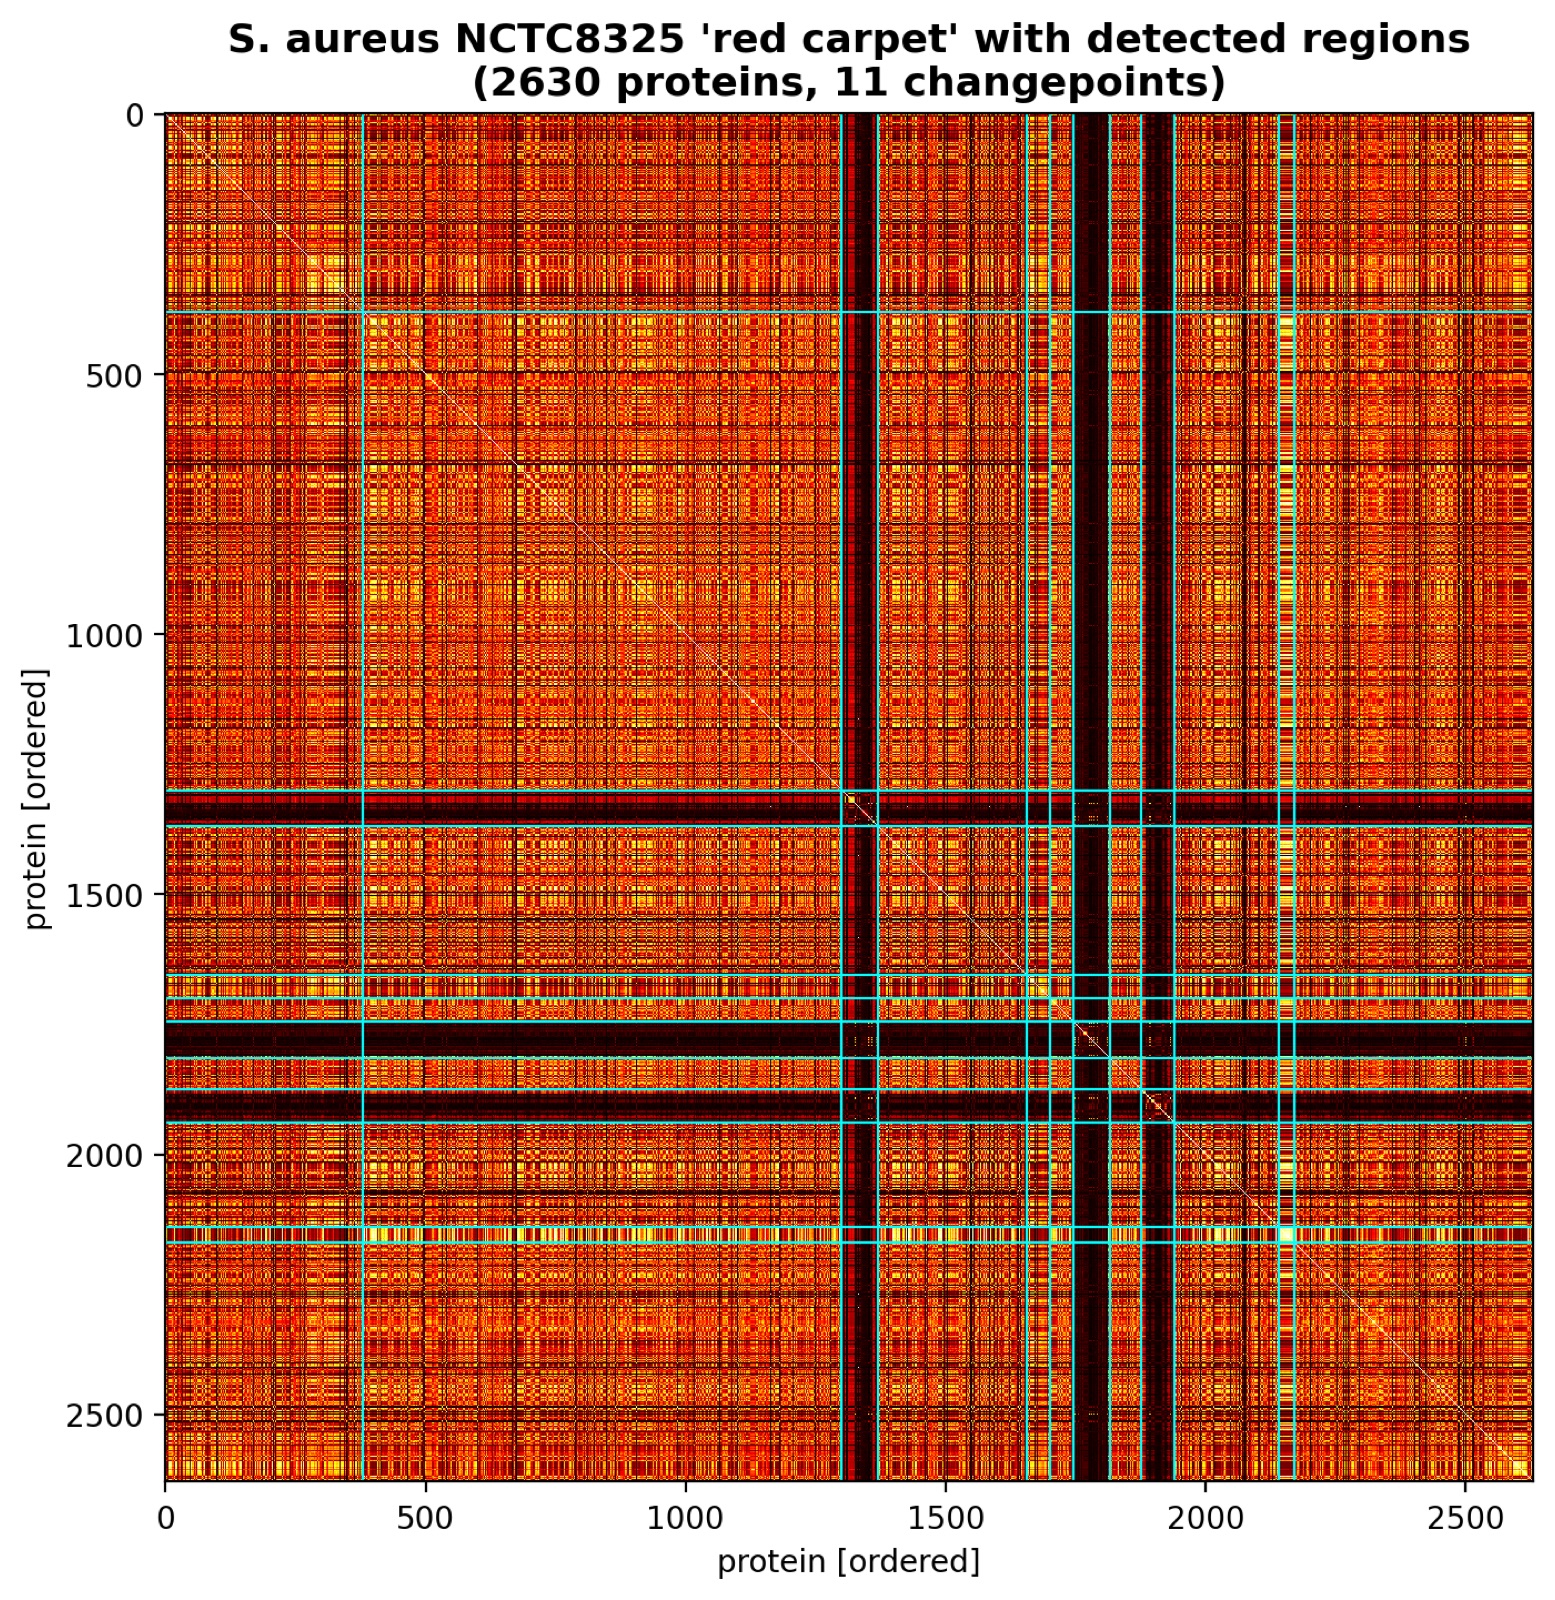
RedCarpet finds those stretches without aligning anything. For every protein it asks which genomes in the database carry an exact copy of it, then compares those genome sets between proteins. Proteins that share a history share a set, so ordering the proteins along the chromosome turns the comparison into a signal, and a recombined block shows up as a stretch where that signal shifts. Detecting the shifts is a changepoint problem, and Figure 1 below is the detector running on S. aureus NCTC8325.

Presentations

Files

Figures

A square heatmap of similarity between every pair of the 2,630 proteins of S. aureus NCTC8325, ordered along the genome. It is mostly orange and red, crossed by dark bands, with cyan lines marking the eleven detected changepoints.
Figure 1. The 2,630-protein similarity matrix for S. aureus NCTC8325. Proteins are ordered along the genome, so a run of proteins that share a history shows up as a bright block on the diagonal. The cyan lines are the eleven changepoints the detector placed at the region boundaries.
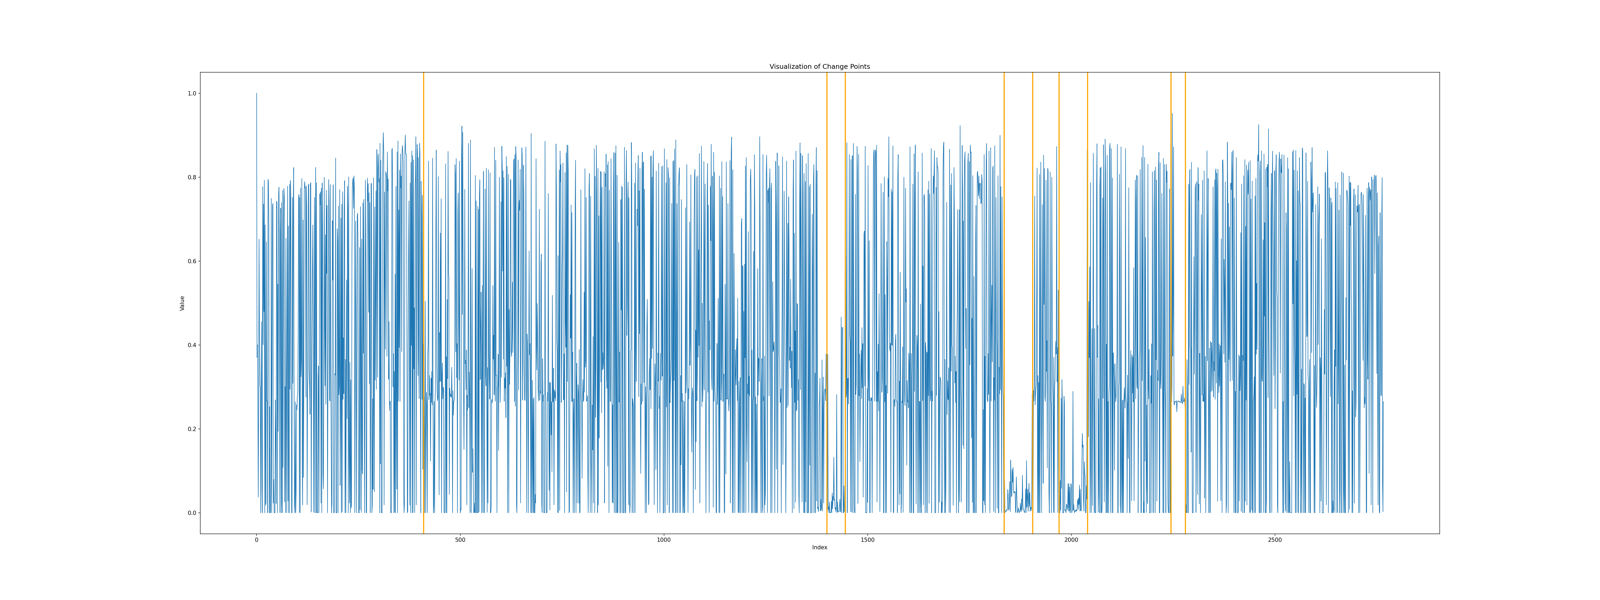
A line plot of one protein's similarity to every other protein against position along the genome, with orange vertical lines at nine changepoints. Inside two of the detected regions the signal drops to near zero.
Figure 2. A single row of the matrix from another run, which is the first protein's similarity to every other protein in the order they sit on the genome, with that run's changepoints drawn over it. The detector works on the whole matrix, and one row is only a way of seeing what it responds to, which is the stretches where the similarity falls to almost nothing.
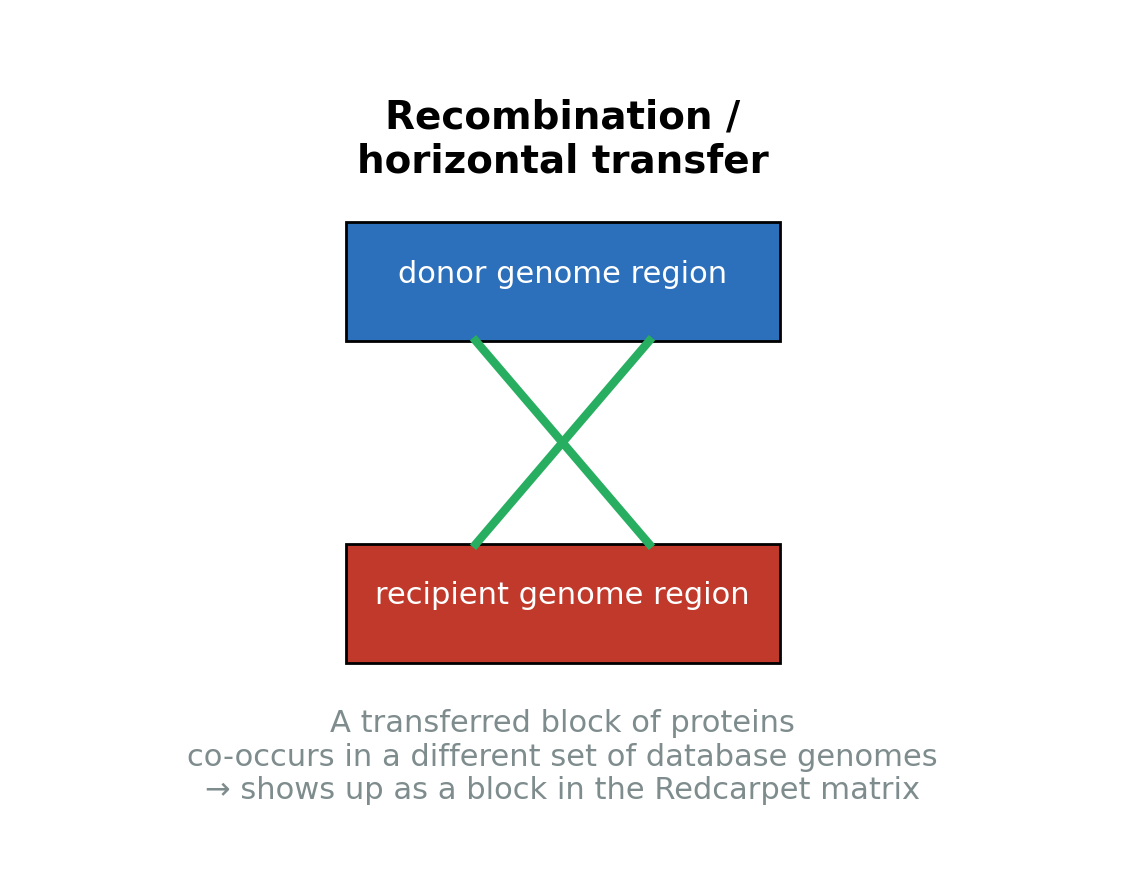
Diagram of recombination, or horizontal transfer: a donor genome region above a recipient genome region, joined by two crossed lines. A note underneath says a transferred block of proteins co-occurs in a different set of database genomes and so shows up as a block in the Redcarpet matrix.
Figure 3. Recombination moves a block of DNA from a donor genome into a recipient. That block then co-occurs with a different set of database genomes than the rest of the chromosome does, and that difference is the whole signal the method is built on.
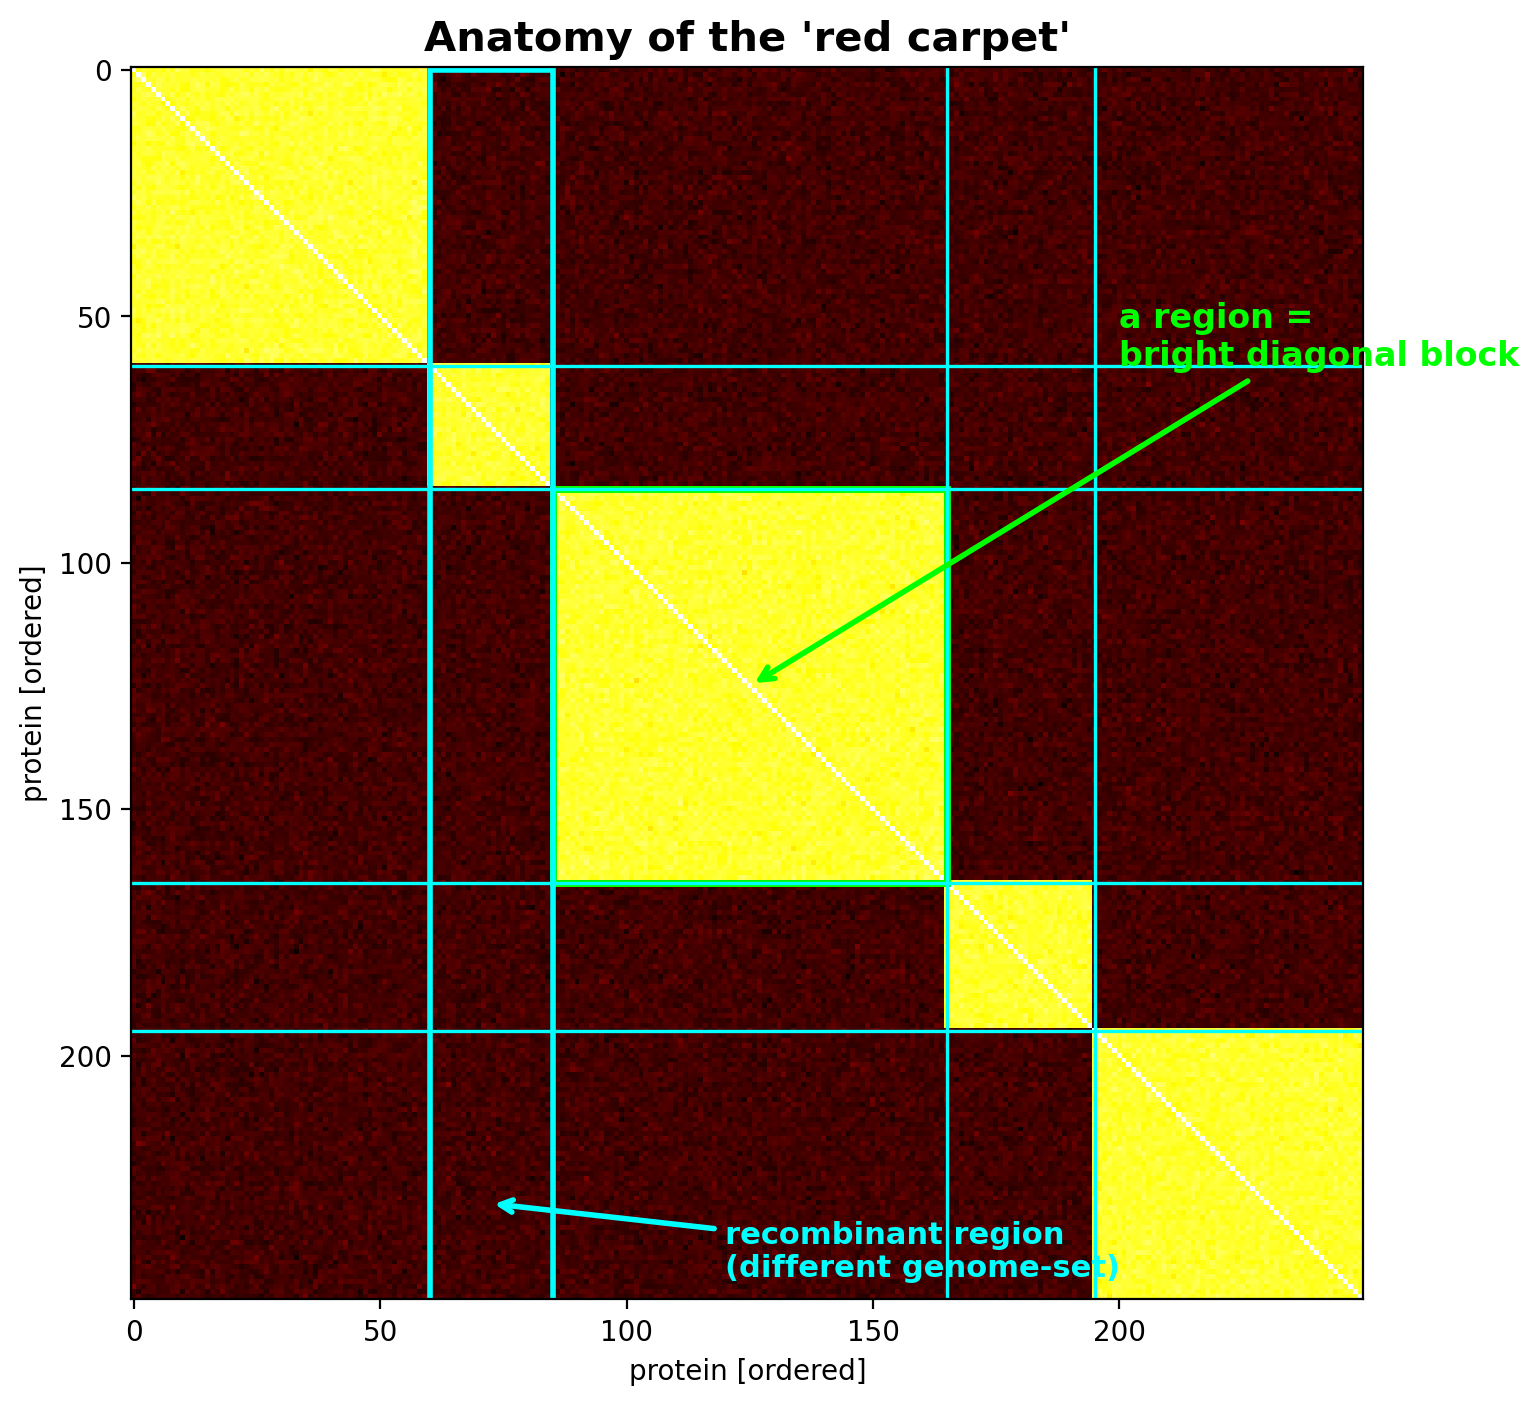
A synthetic similarity matrix: bright yellow blocks along the diagonal on a dark red field, cyan lines at the block boundaries, one bright block labelled as a region and a dim band labelled as a recombinant region with a different genome set.
Figure 4. A recombinant stretch reads as a band that is dim against the core genome but bright within itself. This figure is the reference I used to explain what the detector is looking for before showing it running.
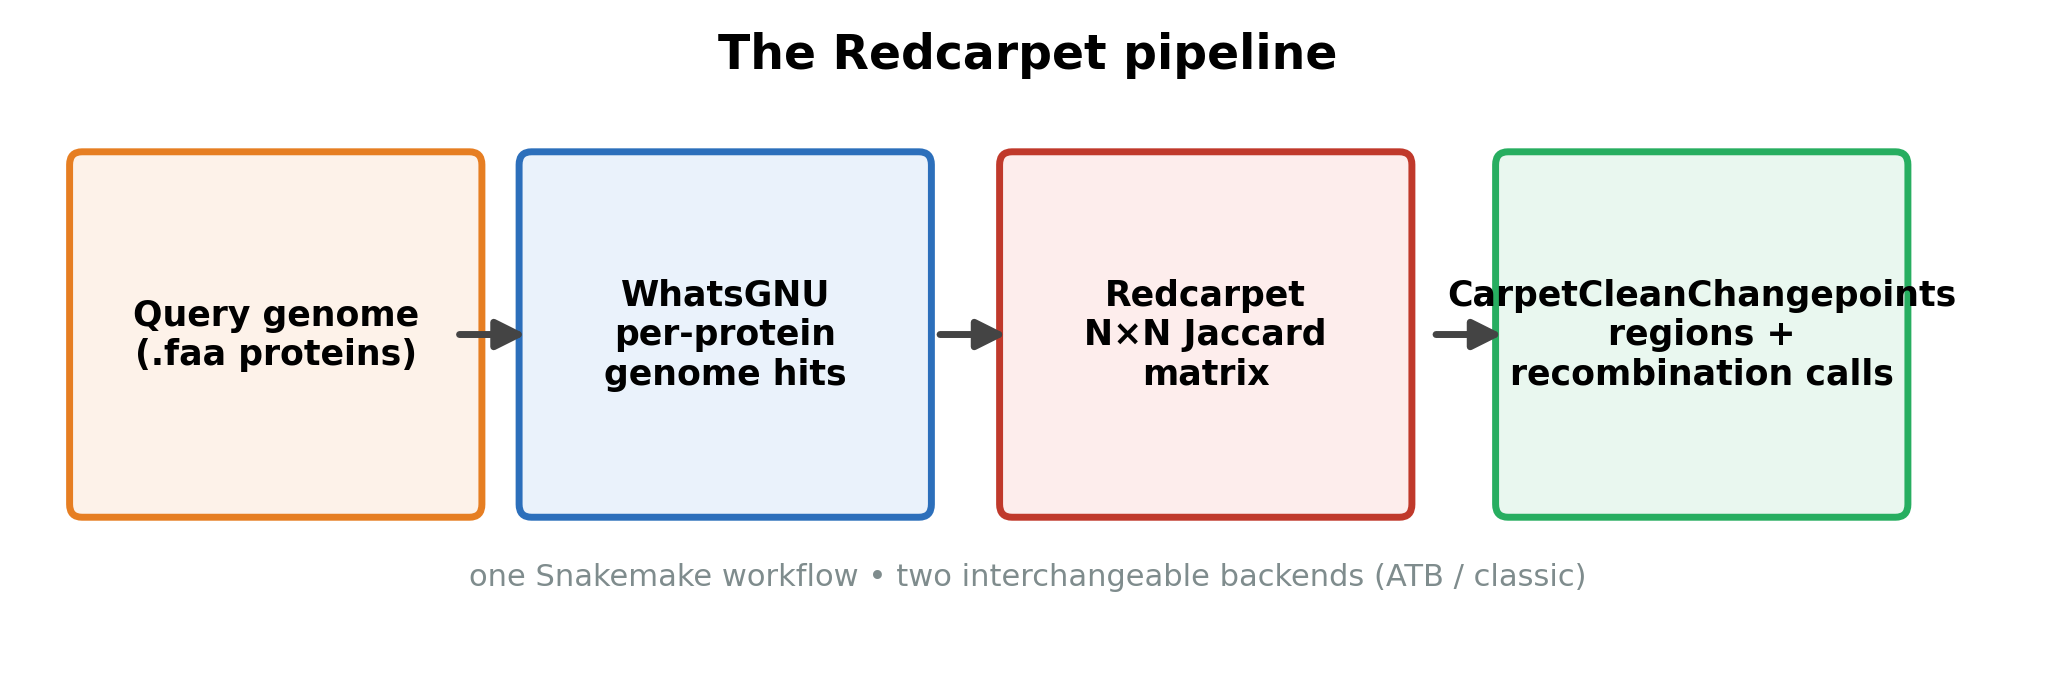
Flow diagram of the Redcarpet pipeline in four boxes: the query genome's proteins, WhatsGNU per-protein genome hits, the Redcarpet N by N Jaccard matrix, and CarpetCleanChangepoints producing regions and recombination calls, run as one Snakemake workflow.
Figure 5. The Snakemake workflow, from genome in to region calls out. Making it a workflow rather than a set of scripts is what let other people in the lab run it without me.
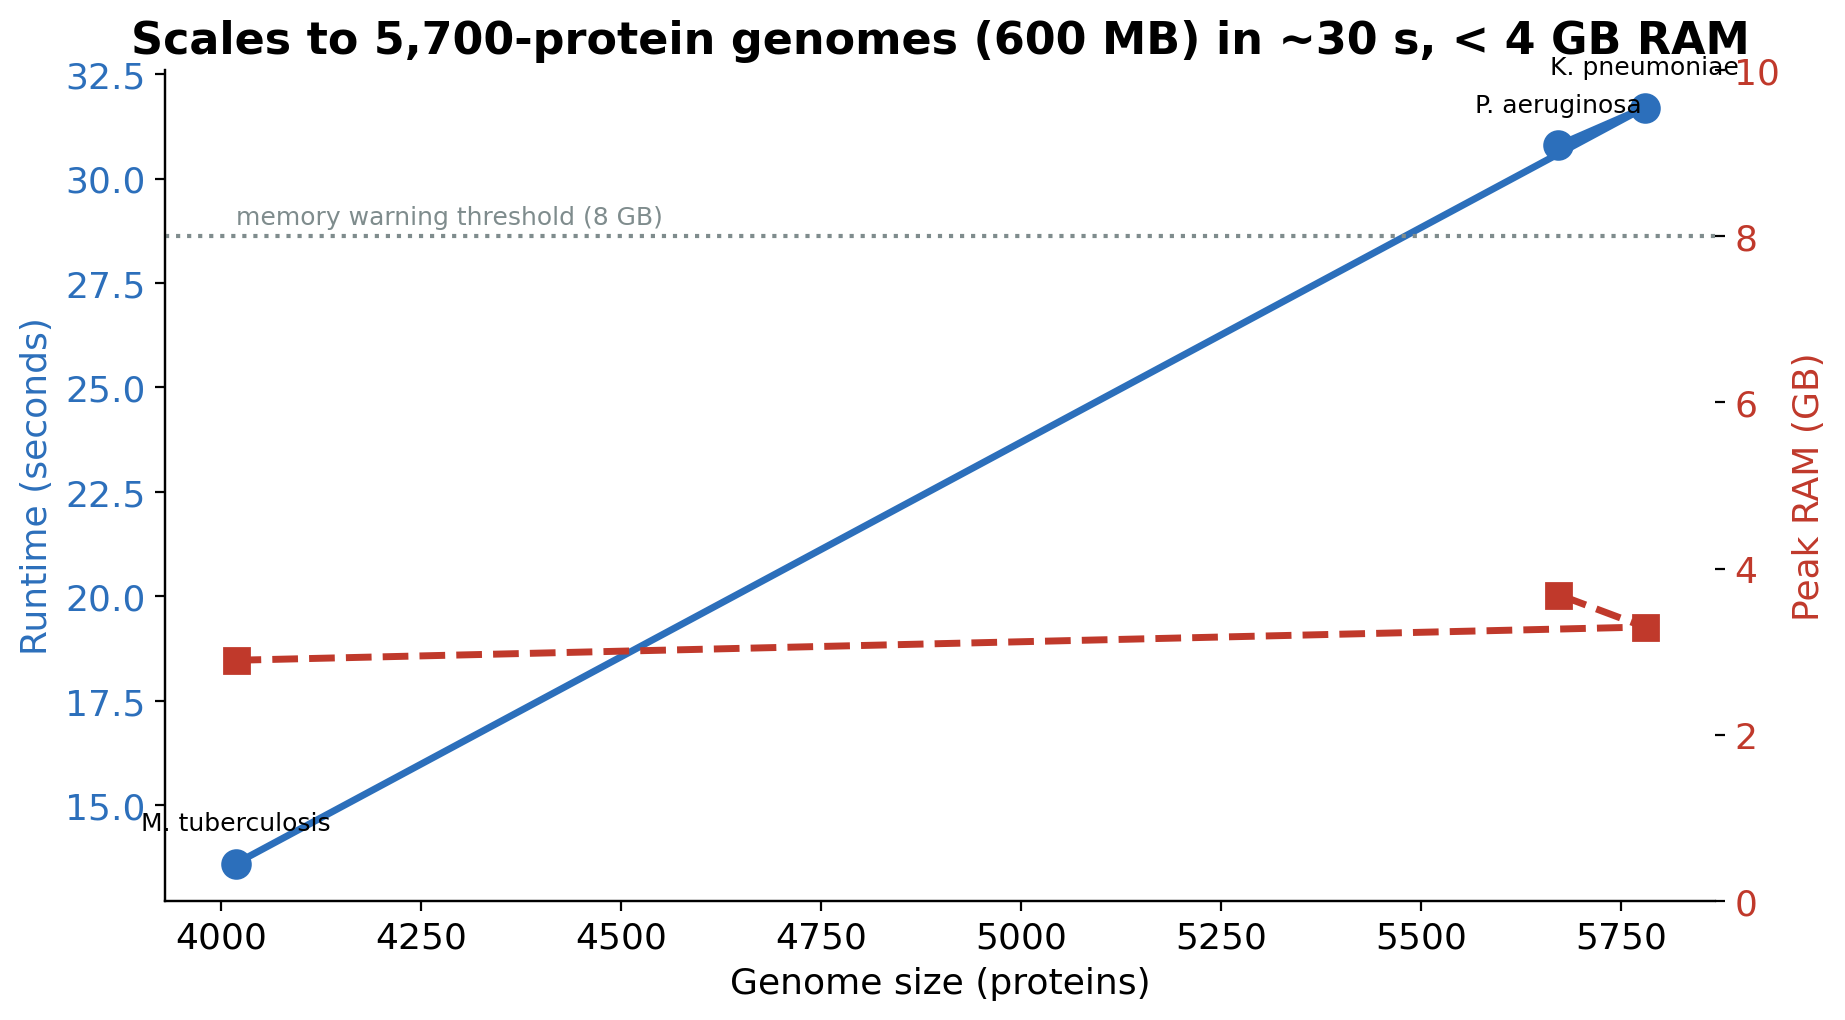
Runtime in seconds and peak memory in gigabytes against genome size in proteins, for M. tuberculosis, P. aeruginosa and K. pneumoniae. Runtime rises from about 14 to 32 seconds while peak memory stays under 4 GB.
Figure 6. Measured on genomes up to 5,700 proteins. The rewritten matrix engine is 27× faster than the original and produces byte-identical output, which is the only reason it was safe to swap in.

← BACK TO HOME